
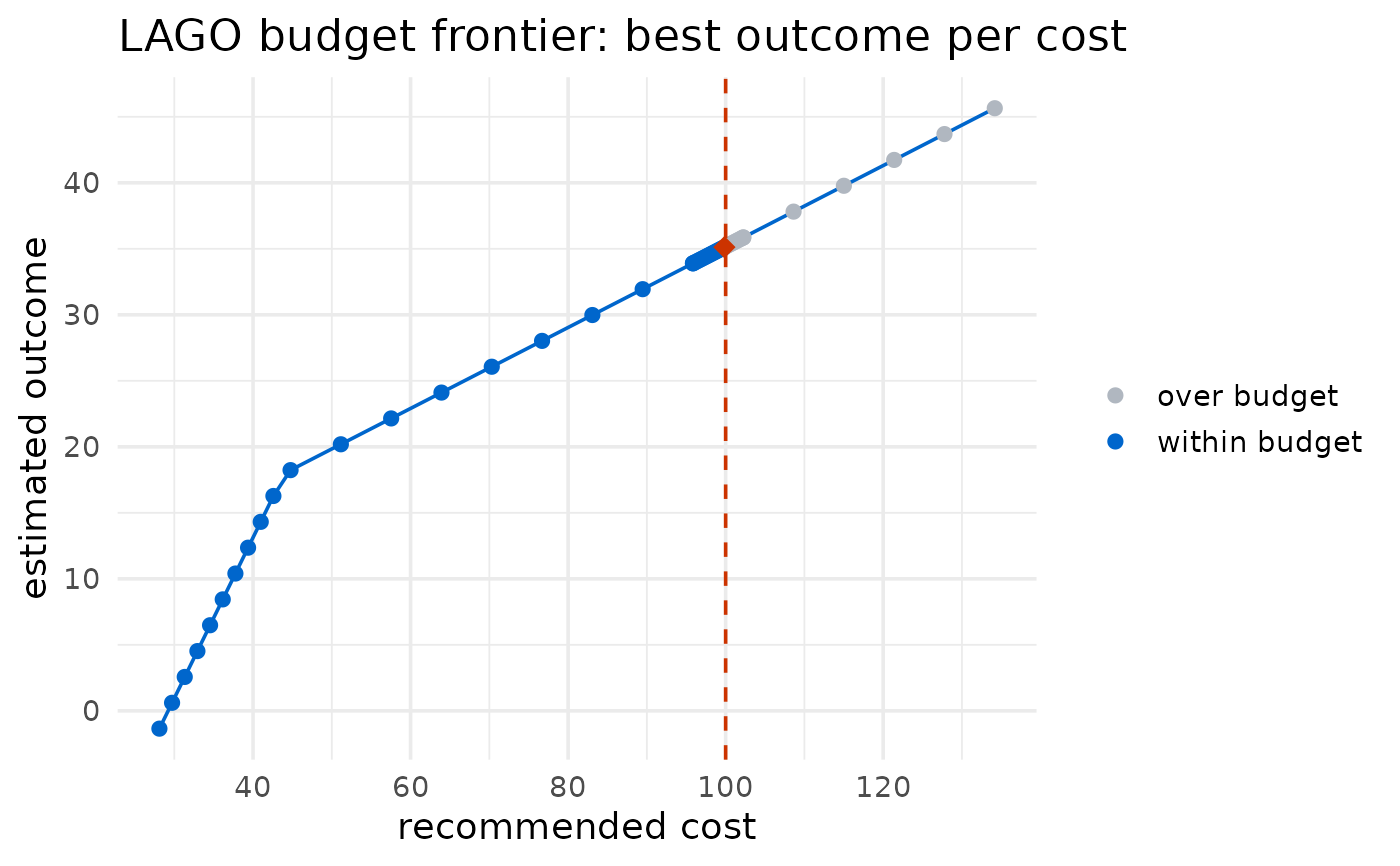
Draws the cost/outcome frontier the search traced out (estimated outcome against recommended cost across the swept goals), with a vertical line at the budget and the chosen recommendation highlighted.
Usage
# S3 method for class 'lago_budget'
plot(x, ...)Value
A [ggplot2][ggplot2::ggplot] object, or `NULL` invisibly when there is nothing reachable to plot.
Examples
# \donttest{
b <- lago_budget(
data = mtcars, outcome_name = "mpg", outcome_type = "continuous",
glm_family = "gaussian", link = "identity",
intervention_components = c("gear", "qsec"),
intervention_lower_bounds = c(0, 0),
intervention_upper_bounds = c(10, 350),
cost_list_of_vectors = list(c(0, 4), c(4, 6)),
outcome_goal_intention = "maximize", budget = 100
)
plot(b)
 # }
# }