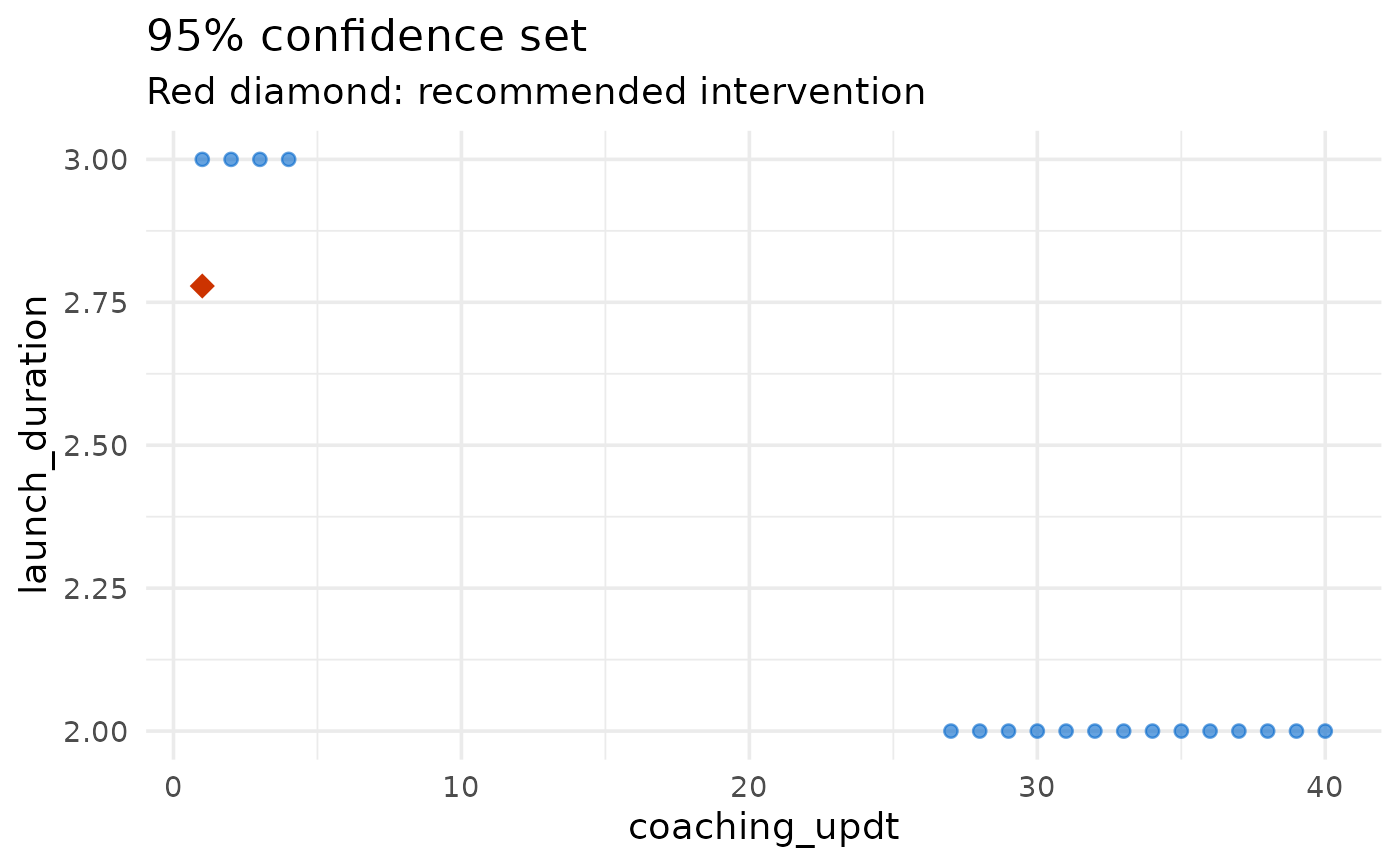
Visualizes the 95% confidence set. For a two-component intervention it plots the grid points in the confidence set with the recommended intervention highlighted; for a single component it plots the confidence interval bounds against the dose. A non-empty confidence set is required. `result$cs` can be NULL even with `include_confidence_set = TRUE` (its default), when no confidence set was found for the outcome goal or the shrinking method was used, and then plot() returns invisibly with a message rather than erroring.
Usage
# S3 method for class 'lago'
plot(x, ...)Examples
# A plot needs a non-empty confidence set: plot() returns invisibly with a
# message when result$cs is NULL, which can happen even with
# include_confidence_set = TRUE (its default) if no confidence set was found
# for the outcome goal, or if the shrinking method was used.
# The lower bounds start at 1 while the data also contains 0s, so the
# optimizer warns about that; the warning is expected here.
result <- lago_optimization(
  data = BB_data,
  outcome_name = "pp3_oxytocin_mother",
  outcome_type = "binary",
  glm_family = "binomial",
  intervention_components = c("coaching_updt", "launch_duration"),
  center_characteristics = c("birth_volume_100"),
  center_characteristics_optimization_values = 1.75,
  intervention_lower_bounds = c(1, 1),
  intervention_upper_bounds = c(40, 5),
  cost_list_of_vectors = list(c(0, 1700), c(0, 8000)),
  outcome_goal = 0.85,
  outcome_goal_intention = "maximize",
  include_confidence_set = TRUE,
  confidence_set_grid_step_size = c(1, 1),
  quiet = TRUE
)
#> Warning: The lower bound for the intervention component coaching_updt is greater than the minimum value in the data.
#> Warning: The lower bound for the intervention component launch_duration is greater than the minimum value in the data.

# Two components: the confidence set grid with the recommended
# intervention marked.
plot(result)